Use analytical reports to generate hypothesis
A well-formulated hypothesis should be a blend of all the effective elements. It cannot be formulated merely on the framework of pinpointing a problem, creating a solution and forecasting its results. A hypothesis report is incomplete without reporting and analytical tools.
Both work as powerful tools while generating ideas for experimentation. Data Analytics allow you to focus your experimentation ideas on vital opportunities. Analytics and not just customer insights help you to build a clear picture of your user’s expectations. Also, you can use the reporting and analytics to fulfil your customer’s expectations.
What does Data Analytics help you redefine :
1. Know your customers
The first step to look into the data analytics is to know your customers as well as customer insights. Know about your customer’s experience on your site and connect it to your company’s goals such as measuring conversion rates. Know who your customers are, what are their expectations. Check whether your products and strategies are matching people’s expectations.
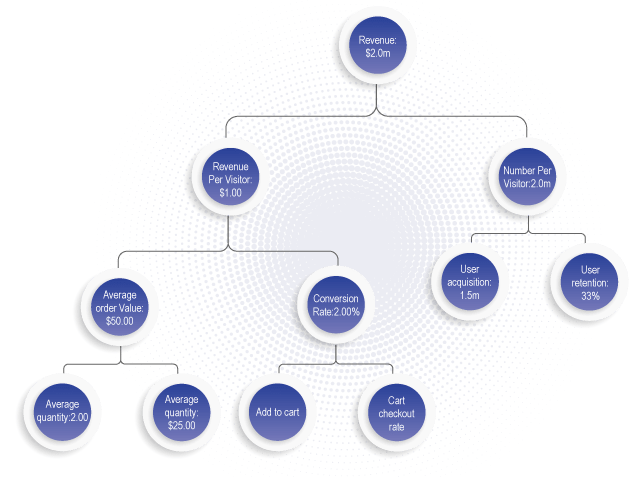
Create a goal tree to improvise the key metrics of your company with the help of an experimentation program.

Once you know the customer insights on your site. Connect them with your key performance indicators for your experimentation program. Now utilize the data analytics to know whether the visitors’ behaviour is driving the key metrics.
Use the following customer insights to develop new strategies to conduct experimentation program :
- Know how did your customers find you ?
- Know the source of the customers.
- Where do they land first on your site ?
- Which are the most used paths and features ?
2. Know your influential visitors
Your unique visitors will define the duration of your experiments. You can fasten up the process of optimization if you run an experiment during the increased flow of traffic on your website.
Get the following insights :
- No. of unique visitors rushing to your site at peak intervals such as in a day, in a week or in a month.
- Know the high and low periods in your website traffic?
- Watch out for the trends seasonally or at time intervals.
Try to run experiments on the pages where visitors are engaging with your key goals. For example - Your main goal is to get maximum no. of visitors who turn into customers i.e. your conversion rates. In other words, focus on the pages which align with your goal such as product details page which will trigger a user’s purchasing decision.
That is how you can easily know the difference in the upsurge of conversion rates from the new and returning customers.
3. Get a view of acquisitions
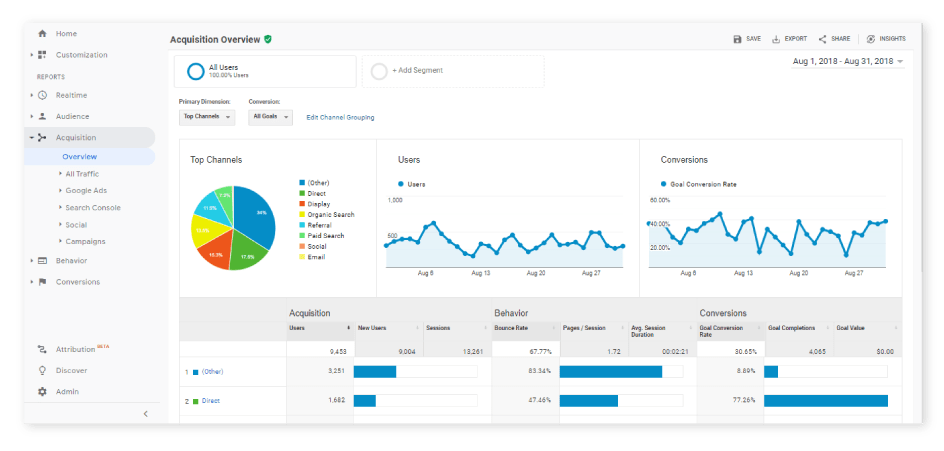
An acquisition report provides you with valuable insights into the source of your visitors and which channels you are required to optimize.
Utilize the report to recognize :
- Know the best traffic sources.
- Identify how the performance is contrasting between different channels.

Let’s have a look at an example :
Let’s say you observed that the direct traffic is bouncing from the page. You created a hypothesis: Traffic rates might be bouncing due to the fact that visitors are not able to find great content. Hence, you created a hypothesis on the basis that visitors are browsing through your website for great content. So, you can create catchy content and new products on your webpage to get maximum no. of acquisitions.
4. Identify the trends on device type
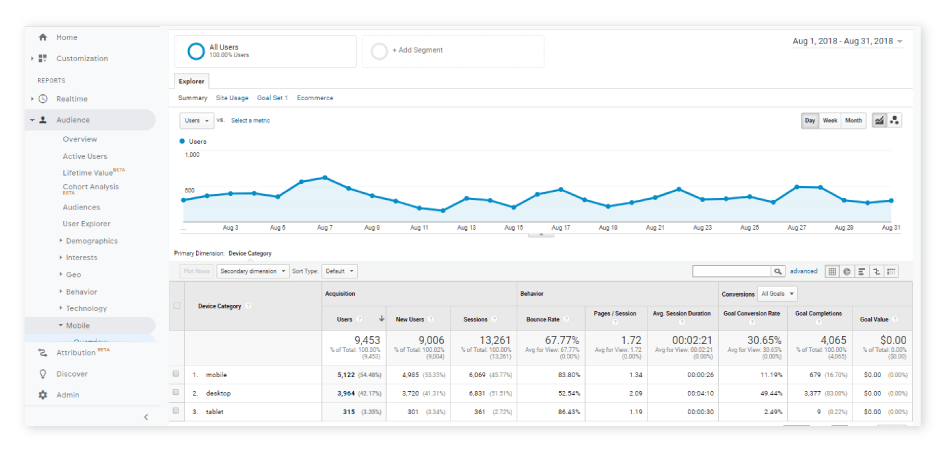
Watch out your strongest audience through customer segmentation on the basis of device type :
- Watch out for the difference between the mobile device or the operating system ?
- Analyze if any collapse between the device type is aligning you or separating you from the industry standards.

Grab this information to know whether you are optimizing rightly according to the device type or browser. In order to know if you are on the right track or not. Observe if the desktop to mobile conversion rates are lower or apt according to the industry standards. In case they are lower, then you must grab this oppurtunity to optimize the conversion rates.
5. Know the geographical trends
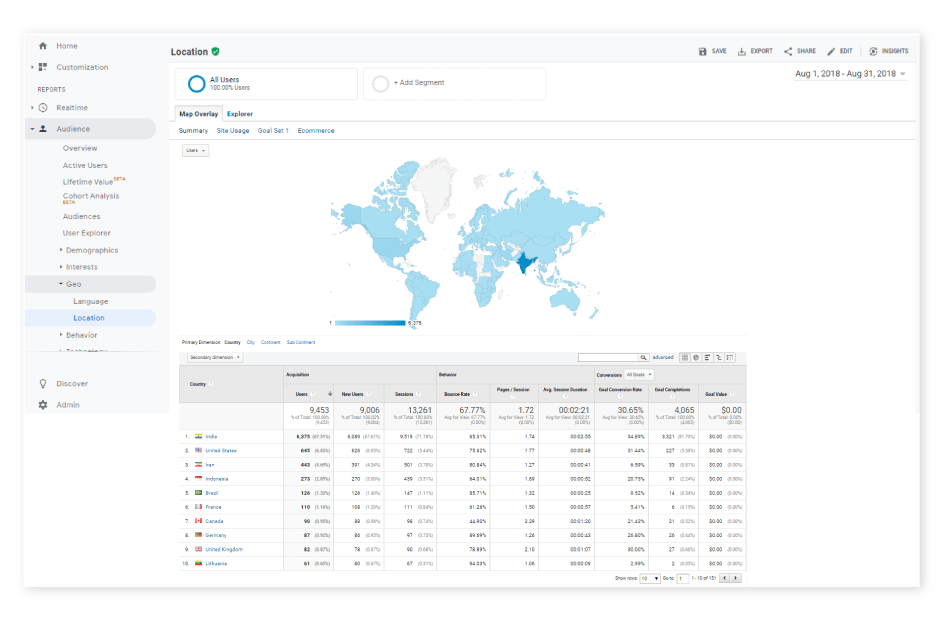
Identify visitor behavioral trends by segmenting visitors on the basis of their location. Now, take the right steps to optimize web pages.
Customers' insights on the basis of their geographical trends :
- Know the location of your visitors.
- See how does the performance is differing by a city or a country.
- Know on which regions you must divert your efforts on for optimization ?

Forex - Let’s say, visitors in India is browsing more through your website as compared to the visitors in U.K. and U.S. Therefore, the bounce rates are much lower in these areas. You must know the reasons to optimize your websites and fetch more visitors from those areas as well. You can know the common trends in their behaviour ( why visitors are leaving your site or why they are coming to your site ) through the use of direct data.
Master the art of physics-based navigation in Drive Mad unblocked, where your tactical decisions guide nimble cars and powerful trucks through hazardous terrain to determine their ultimate fate.
Great insight! ? Using analytical reports as the backbone of hypothesis generation ensures that ideas are grounded in real data rather than assumptions. This not only sharpens experimentation but also alignssolutions with actual customer behavior and expectations. A data-driven hypothesis always has stronger potential for impactful outcomes.
if you're looking for an unforgettable experience with a Call Girls in Hyderabad, look no further than our Karishma sharma portfolio helps meet best dating girls. Call Girls in Amritsar Call Girls in Ahmedabad Call Girls in Bangalore Call Girls in Bhopal Call Girls in Chandigarh Call Girls in Chennai Call Girls in Delhi Call Girls in Goa Call Girls in Gurgaon Call Girls in Jaipur Call Girls in Kolkata Call Girls in Lucknow Call Girls in Mumbai Call Girls in Pune
The Orange Hell in Getting Over It is one of the most notoriously tricky sections of the game. It’s a steep, narrow climb with almost no room for error. One wrong move can send you back to the bottom. The awkward hammer mechanics and lack of stable footholds make it an actual test of precision, control, and nerves
You can use analytical reports to generate hypotheses by analyzing user behavior, traffic sources, and engagement metrics. For example, if your website's analytical data shows that a significant number of users visit the **Honista for iPhone** page but have a high bounce rate, a possible hypothesis could be that users are not finding the information they need or the page load speed is slow. Testing different content formats, improving page speed, or adding more engaging visuals can help validate this hypothesis. Check out **Honista For iPhone** to see how user behavior analysis can optimize content and improve engagement.
The example about direct traffic bouncing due to lackluster content is a great illustration—simple, relatable, and shows how a hypothesis can Sprunki Pyramixed spring straight from the data.
Get ready for high-speed chases and dangerous escapes in escape road city 2! Dodge traffic, avoid obstacles, and escape the city’s chaos before it’s too late.
I've always enjoyed challenging experiences that test patience and skill. Recently, I came across something that truly pushes limits and keeps you engaged for hours. The mechanics are simple yet incredibly rewarding once you get the hang of it. Definitely a great way to challenge yourself and improve over time
Curve Rush is so addictive. I always tell myself "just one more try," but before I know it, hours have passed. So fun!
I have read all the comments and suggestions posted by the visitors for this article are very fine. visit me mefact.org
My experience with Escape Road has been nothing short of thrilling. The game’s design takes you on a rollercoaster of emotions with its mysterious storyline and intricate puzzles. Every challenge felt innovative, forcing me to constantly adapt my strategies. It is undoubtedly a masterclass in combining artful storytelling with challenging gameplay.
Best Chalk Paints made By Woodle India
Best Chalk Paints made By Woodle India
Best DIY MDF Cutouts Selled by Woodle India
Best DIY MDF Cutouts Selled by Woodle India
best Custom DIY Products Manufactured in Woodle India
best Custom DIY Products Manufactured in Woodle India
best Custom DIY Products Manufactured in Woodle India
Analytical reports provide data-driven insights that help identify patterns, trends, and anomalies, forming the basis for generating hypotheses. By examining key metrics and correlations, businesses can make informed decisions and test assumptions effectively. This approach enhances problem-solving and strategic planning. Start here to explore how analytical reports can drive hypothesis generation.
Rocket Bookkeeper’s expertise in investments business bookkeeping ensures financial stability and growth.
The section on knowing influential visitors and running big tower tiny square experiments during peak traffic times really stood out—it’s a clever way to maximize impact.
A well-rounded approach to data analytics can indeed redefine a business's strategies by focusing on customer insights, acquisition channels, and behavioral trends. It’s like how Singapore’s dining scene tailors to diverse tastes and preferences. Just as data reveals valuable insights, understanding diners' preferences has led to vibrant menu options across the city. For instance, exploring Sushiro foods shows how Japanese flavors are crafted to suit local tastes, offering unique dishes that resonate with Singaporean dining trends. Combining analytics with customer preferences, much like restaurants do, helps businesses meet expectations more effectively.
Being a CCGT Insert provider of total solutions, you can Carbide Turning Inserts surely benefit and enjoy Milling Inserts drilling Insert the high feed milling Insert best possible production conditions. We integrated into research and tungsten long inserts carbide wear inserts development, Milling Inserts production, Carbide Inserts marketing, and exporting services.
many mobile services also offer maintenance services, such as system optimizations and software updates, to keep your devices running smoothly tablet repair glasgow.
uno online isn't just about the cards - climb online leaderboards and see how you stack up against Uno players worldwide.
Comparing two versions of something, usually web pages or mobile app screens, is what A/B testing, sometimes called split testing, is all about geometry dash breeze
This is exactly why it is actually better which you can related exploration well before delivering. It will be possible to publish bigger report using this method. ??????
This valuable appear to be most certainly good. Those very tiny facts are designed implementing a wide variety for experience know-how. That i love the reasoning behind a lot. ?? ????? ??
Cyber security companies deploy sophisticated threat monitoring tools and technologies to detect and respond to advanced cyber threats in real-time codesealer. By monitoring network traffic, analyzing anomalous behavior, and leveraging threat intelligence, these companies can proactively defend against sophisticated cyber attacks.
By leveraging analytical reports to generate hypotheses, you can uncover hidden insights, drive evidence-based decision-making, and advance knowledge advanced rheumatology in your field through systematic inquiry and exploration. Analytical reports generate hypotheses, you can uncover hidden insights, drive evidence-based decision-making, and advance knowledge.
I would like to express my deepest appreciation to the author for their incredible dedication and tireless effort in geometry dash producing this extensive article that has undoubtedly required countless hours of research, analysis, and writing.
I appreciate you taking the time to thoroughly show me how to construct NPS email templates. I've stored this knowledge so I may share it with other people geometry dash world.
I like your article! It is very informative. I also read about it here http://promo-popup.com/
You can find more information here: https://wellmage.com/